2025: The Year in Review
U.S. stock markets enjoyed their third year in a row of positive gains in 2025. The S&P 500 returned 17.9% for the year while the Dow Jones Industrial Average was up 13% and the NASDAQ index finished up 21.2%.
This calendar year return masks the bear market we had intra-year when the market plunged from February 19th to April 8th by -19%, triggered by the tariff threats and initial imposition of tariffs.
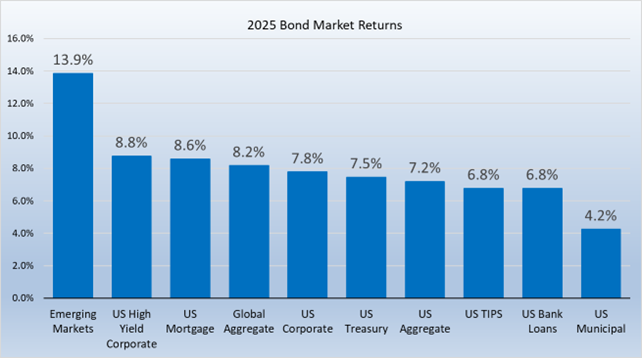
Bond markets also fared well as the Bloomberg Aggregate Bond Index returned 7.2%. There was not much dispersion among the fixed income asset classes with the exception of emerging markets debt which returned 13.9% in 2025.
Several themes emerged or continued in 2025. Among them:
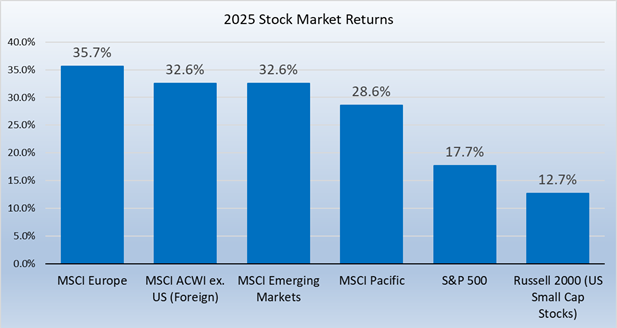
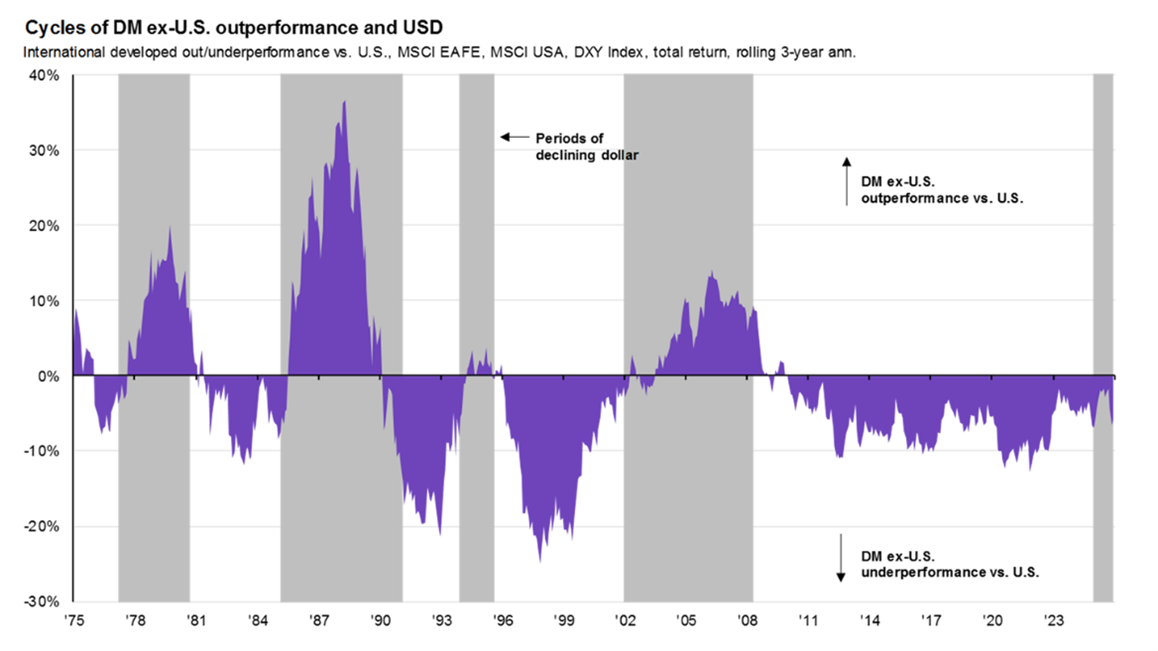
International markets outperformance: After a prolonged period of underperformance versus U.S. markets, international stocks nearly doubled the return of U.S. stocks as evidenced by the 32.6% return of foreign markets (MSCI All Country World Index ex US). This can be attributed to several factors; a weakening U.S. dollar, much lower valuation metrics of foreign stocks, increased spending by foreign governments to spur their economies and a softening of regulations among other country-specific factors. The graph below shows the underperformance of international stocks since 2008 as well as past cycles of over and under-performance (based on three-year rolling returns).
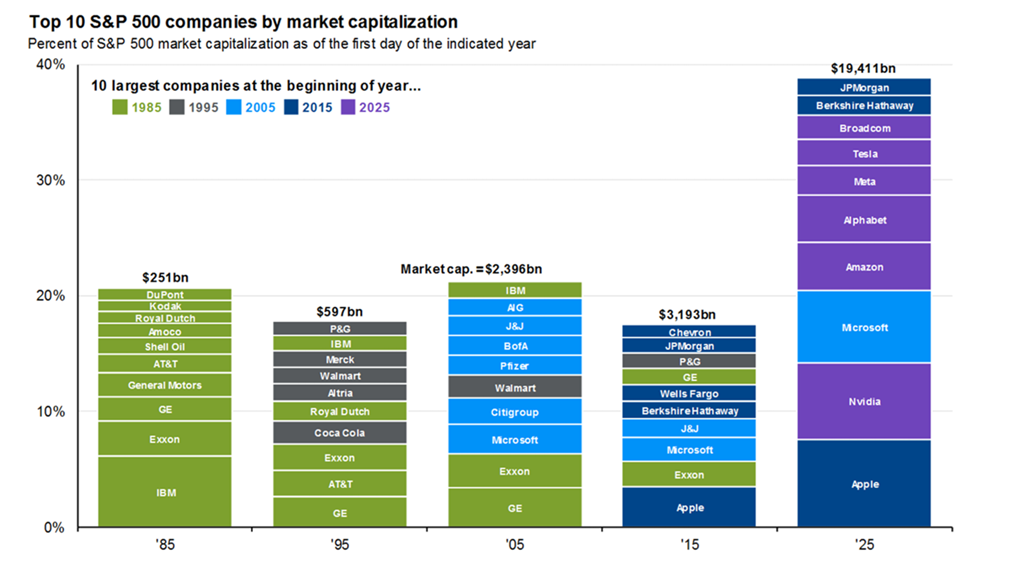
Concentration of largest stocks: The top 10 stocks in the S&P 500 represented 39% of the market at the beginning of 2025. That number today has actually increased to 41%. The graph depicts how in the previous four decades the concentration of the top 10 companies by market cap has hovered around 20%.
These top ten stocks have also driven returns over the past three years. This can be expressed visually by comparing the S&P 500 (which is weighted by market cap or size) to the S&P 500 equal weighted index (same 500 socks, just weighted equally). Due to the outsized returns of the top ten stocks the cap weighted index (purple line) significantly outperforms the equal weighted index (orange line).
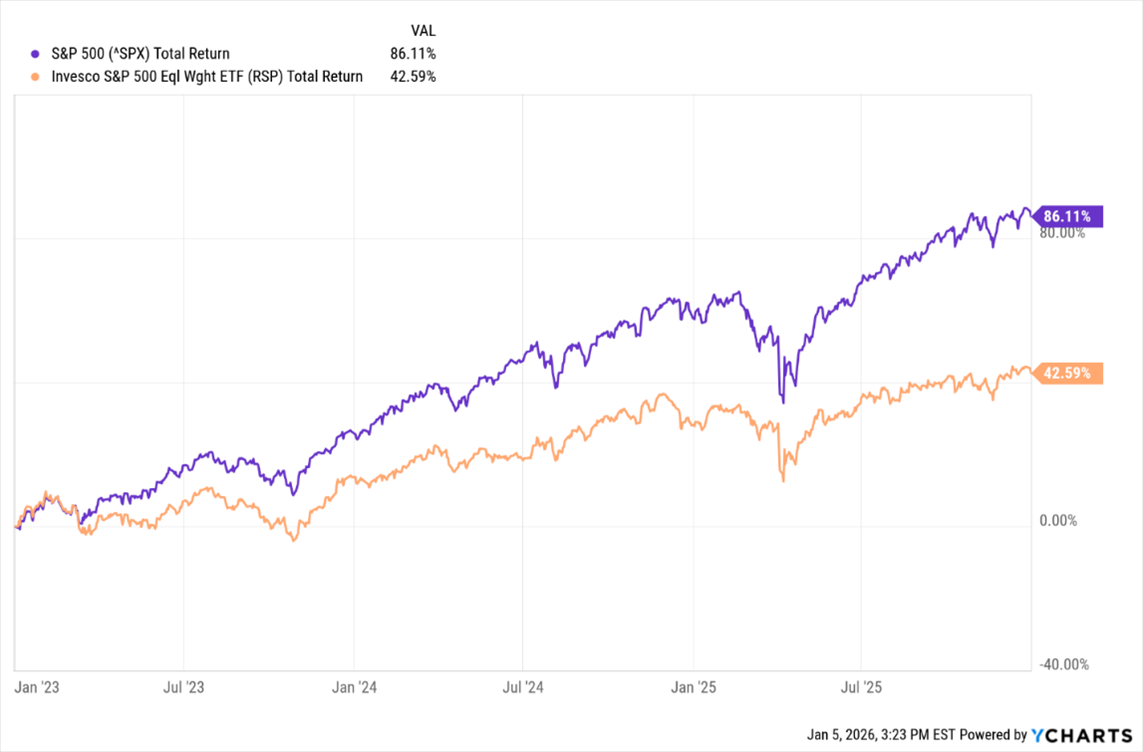
For 2026, signs are emerging that market breadth will expand. Earnings growth for the rest of the market are expected to increase while the largest stocks continue to grow earnings but at a decelerating pace. Also, valuations are stretched in the largest companies while the rest of the market is priced much more reasonably. The Price/Earnings ratio (P/E ratio) of the S&P 500 is 22, while the equal-weight S&P 500 is a more palatable 17.
Fed easing cycle: The Federal Reserve resumed easing this year, which lowered borrowing costs and brought mortgage rates down to 6.4% from 7.1%.
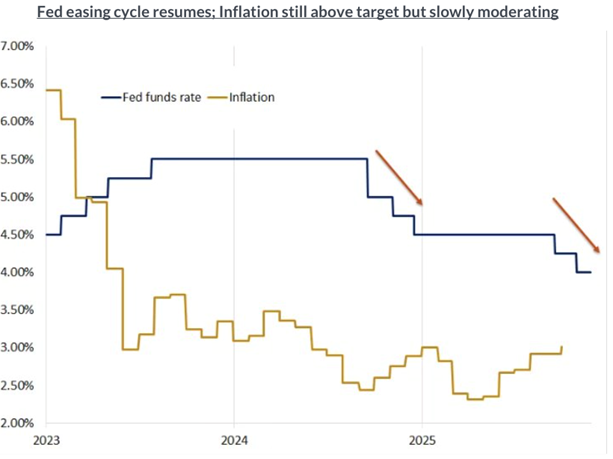
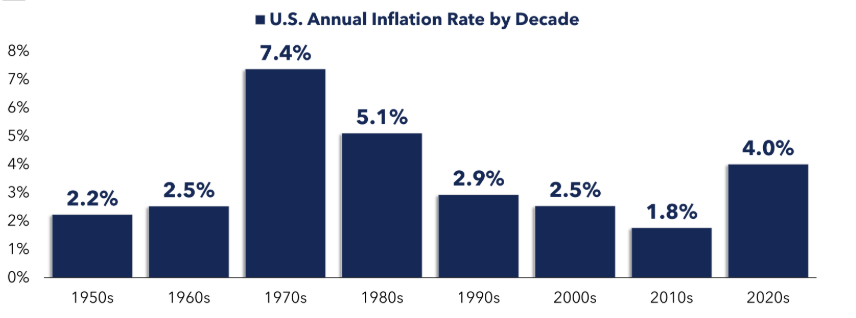
The Fed is being pulled in two directions; it wants to maintain full employment and a healthy economy, while keeping inflation low. The employment picture is showing some cracks with the unemployment rate currently at 4.6% up from 4% at the beginning of the year, while inflation has been stubborn but cooling slowly; headline CPI has slowed to 2.7% from 3% this year. While the Fed’s target is 2% inflation, the historical inflation rate over the past 75 years or so is 3%.
Will the Fed choose slightly elevated inflation in order to shore up unemployment and boost the economy in 2026? Adding to the uncertainty will be the appointment of a new Federal Reserve president in April. Consensus predicts a gradual downward rate path through 2026, supporting growth and markets, however it remains data dependent.
Productivity: Speaking of unemployment, one of the most puzzling features of the expansion is the growing disconnect between output and jobs. Payroll growth has slowed in the past year and the unemployment rate has edged higher. On its face, that looks like an economy losing momentum. However, GDP growth is accelerating. One possible explanation is a boost in productivity. Capital intensive investment, particularly in artificial intelligence and other technology, boosts output without requiring large additions to payrolls.
K shaped economy: Spending by higher-income households, which are less sensitive to interest rates and labor market shifts, continues to drive a disproportionate share of consumption. Household consumption driven by higher-income consumers and AI-related investments accounted for 70% of total growth in the economy. Yet consumer sentiment remains at significant lows. This disconnect explains why the public, particularly those with lower incomes, remains sour on the economy.
2026:
For now, growth keeps beating expectations and domestic demand is holding up. The usual warning signs keep flashing, but the slowdown is nowhere in sight.